

Hello Friends, in this blog post we are going to see “Microsoft Word, Excel, and PowerPoint differences“.
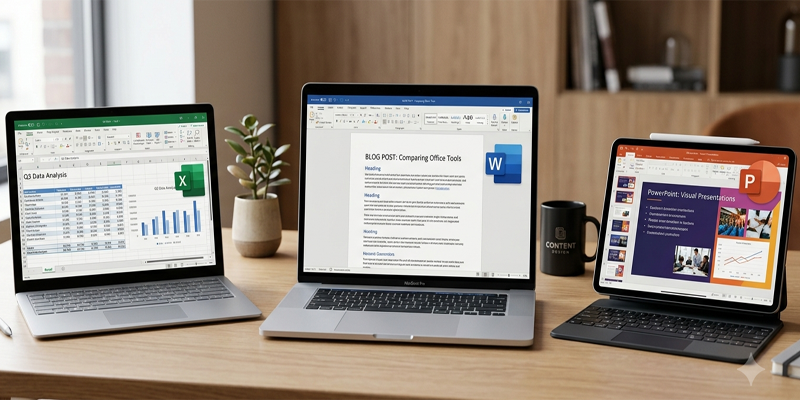
If we observe the ecosystem of Microsoft Office, we see that Microsoft Word, Excel, and PowerPoint are very popular applications and are most widely used across the world.
For assignments and project work, students use them. For detailed reports and analysis, professionals rely heavily on them.
And for information communication, decision-making, and operations management, businesses are very satisfied to use them.
All these applications are installed together within the MS Office installation. But each application is responsible for a dedicated task or serves a different purpose.
Word is used primarily for documents, Excel is known for spreadsheets and data analysis, and PowerPoint greatly helps users make fascinating presentations.
If you properly understand the differences between them, it is definitely going to save your time with improved productivity. And you can easily select the right tool for every task.
In this post, we are going to explore “Microsoft Word, Excel, and PowerPoint differences“.
We will dive deep into the uses, features, advantages, limitations, and the best practices of all these applications having some practical examples showing their collaboration.
1. What Is Microsoft Word?
Microsoft Word is a word-processing application used to create, edit, format, and share text-based documents. It is suitable for everything from a simple school assignment to a detailed business report.
Word helps users organise written information, apply consistent formatting, insert tables and images, and prepare documents for printing or digital distribution.
Main features of Microsoft Word
- Text formatting: Change fonts, font sizes, colours, spacing, alignment, and paragraph styles.
- Page layout: Adjust margins, page orientation, columns, page breaks, and page numbering.
- Spelling and grammar assistance: Identify potential writing errors and improve readability.
- Tables and images: Present information visually within a document.
- Headers and footers: Add page numbers, document titles, dates, and other recurring information.
- References: Create citations, footnotes, endnotes, and tables of contents using supported tools.
- Templates: Start with pre-designed formats for reports, letters, resumes, and other documents.
- Review tools: Use comments and Track Changes to review edits and collaborate with others.
The exact features available depend on your Office edition, platform, and subscription.
Common uses of Microsoft Word
For students: Prepare assignments, practical files, essays, project reports, and research papers.
For professionals: Write proposals, meeting minutes, letters, policies, reports, and official correspondence.
For businesses: Create contracts, invoices, employee documents, manuals, and customer communications.
For personal use: Prepare resumes, invitations, applications, and other everyday documents.
Best practices for Microsoft Word
- Use built-in heading styles instead of manually formatting every heading. This makes documents more consistent and helps generate a table of contents.
- Use page breaks rather than repeatedly pressing Enter to move content to a new page.
- Keep fonts, spacing, and margins consistent throughout the document.
- Use tables for structured information, but avoid making a document unnecessarily complicated.
- Review spelling, grammar, formatting, and page breaks before sharing or printing.
- Save an editable copy in DOCX format and export a PDF when you need a fixed-layout version for distribution.
Example: If you are preparing a school science project, Word is the appropriate choice for writing the introduction, objectives, explanation, observations, conclusion, and references.
2. What Is Microsoft Excel?
Microsoft Excel is a spreadsheet application used to organise data, perform calculations, analyse information, and create charts. It arranges information into rows and columns, with individual cells that can contain text, numbers, dates, or formulas.
Excel is especially useful when information needs to be calculated, compared, filtered, summarised, or updated regularly.
Main features of Microsoft Excel
- Formulas and functions: Perform calculations using functions such as SUM, AVERAGE, IF, COUNTIF, and XLOOKUP where supported.
- Tables: Organise datasets into structured ranges that can expand as information is added.
- Sorting and filtering: Find specific records and arrange information according to selected criteria.
- Charts: Turn numerical data into visual representations such as bar charts, line charts, and pie charts.
- Conditional formatting: Highlight values based on rules, such as overdue payments or low stock.
- PivotTables: Summarise large datasets and compare categories without manually calculating every total.
- Data validation: Control the type of information users can enter into cells.
- Automation: Use tools such as macros, VBA, and Power Query where available to automate repetitive tasks and data preparation.
Common uses of Microsoft Excel
For students: Calculate marks, maintain attendance records, organise research data, and prepare charts for projects.
For professionals: Track tasks, prepare budgets, analyse sales, manage schedules, and monitor performance.
For businesses: Maintain inventory, analyse expenses, prepare financial reports, and evaluate sales trends.
For personal use: Create household budgets, expense trackers, savings plans, and travel cost estimates.
Best practices for Microsoft Excel
- Keep one clear header row and use descriptive column names.
- Store one type of information in each column, such as date, customer name, or payment amount.
- Use formulas instead of repeatedly calculating values by hand.
- Convert structured datasets into Excel tables when appropriate.
- Use data validation to reduce incorrect or inconsistent entries.
- Check formulas, cell references, and totals before relying on the results.
- Keep raw data separate from summaries and charts.
- Protect sensitive information and control access before sharing a workbook.
Example: If you want to calculate marks for 100 students, Excel can automatically calculate totals, percentages, averages, and pass/fail results. If a student’s marks change, the relevant formulas can update the results without requiring you to recalculate everything manually.
Remember that formulas are only as reliable as the data and logic behind them. Incorrect inputs or poorly designed formulas can produce misleading results.
3. What Is Microsoft PowerPoint?
Microsoft PowerPoint is a presentation application used to communicate ideas through a sequence of slides. It combines text, images, diagrams, charts, audio, video, and other visual elements to help audiences understand information.
PowerPoint is useful when you need to explain a topic to a group, present findings, pitch an idea, teach a lesson, or communicate a plan.
Main features of Microsoft PowerPoint
- Slides and layouts: Arrange information into individual slides with suitable content structures.
- Themes and templates: Maintain consistent colours, fonts, and visual styles.
- Images and illustrations: Make concepts easier to understand through visual examples.
- Charts and tables: Present numerical information in a more accessible form.
- Transitions: Control how one slide changes to the next.
- Animations: Reveal or emphasise individual objects and points.
- Slide Master: Apply consistent design elements across multiple slides.
- Presenter tools: Use speaker notes and supported presentation views to help deliver a talk.
- Multimedia: Include supported audio and video content where useful.
Common uses of Microsoft PowerPoint
For students: Create classroom presentations, science project slides, seminar material, and assignment summaries.
For professionals: Present project updates, research findings, business proposals, and training sessions.
For businesses: Prepare sales pitches, product demonstrations, marketing plans, and performance reviews.
For teachers and trainers: Explain complex topics, display diagrams, structure lessons, and guide classroom discussions.
Best practices for Microsoft PowerPoint
- Give each slide one main idea.
- Use short phrases rather than copying entire paragraphs from a report.
- Choose readable font sizes and maintain strong contrast between text and background.
- Use charts and diagrams when they make information easier to understand.
- Keep colours, fonts, and layouts consistent.
- Use animations and transitions sparingly.
- Include sources for external facts, images, and data when appropriate.
- Rehearse your presentation and check it on the equipment you will use.
Example: If you are presenting a science project to your class, PowerPoint can show the objective, method, experiment photographs, results, and conclusion. A few well-designed slides are usually more effective than crowded slides containing the entire project report.
4. Microsoft Word vs Excel vs PowerPoint: Key Differences
The simplest way to distinguish these applications is to consider the main task you need to complete.
| Feature | Microsoft Word | Microsoft Excel | Microsoft PowerPoint |
|---|---|---|---|
| Primary purpose | Writing documents | Calculating and analysing data | Presenting ideas |
| Basic working structure | Pages and paragraphs | Rows, columns, and cells | Slides |
| Best suited for | Reports, letters, essays | Budgets, records, calculations | Lectures, pitches, briefings |
| Calculations | Limited, specialised uses | Extensive formula-based calculations | Basic calculations are not its main purpose |
| Data analysis | Limited | Strong | Mainly for communicating results |
| Visual design | Document layouts | Charts and data visualisation | Slide-based visual communication |
| Long-form writing | Excellent | Not ideal | Not ideal |
| Presenting to an audience | Possible, but less convenient | Possible, but less convenient | Excellent |
| Typical file extension | .docx | .xlsx | .pptx |
All three applications can contain text, images, tables, and charts. The difference is how each application is designed to organise and work with that information.
5. Which Application Should You Use for Different Tasks?
Choosing the correct application at the beginning can make a task much easier.
| Task | Recommended application | Reason |
|---|---|---|
| Writing an essay | Word | Designed for paragraphs and page formatting |
| Preparing a resume | Word | Supports structured, professional documents |
| Calculating student percentages | Excel | Formulas can calculate and update results |
| Managing an inventory | Excel | Records can be sorted, filtered, and analysed |
| Creating a business budget | Excel | Supports calculations, comparisons, and summaries |
| Presenting quarterly results | PowerPoint | Communicates findings through slides and charts |
| Teaching a classroom lesson | PowerPoint | Supports visual explanations and a clear sequence |
| Preparing a detailed research report | Word and Excel | Word explains findings; Excel handles calculations |
| Presenting research findings | PowerPoint and Excel | Excel analyses the data; PowerPoint communicates the results |
For complex projects, you do not have to choose only one application. In many cases, the best approach is to use all three for different parts of the same workflow.
6. How Word, Excel, and PowerPoint Work Together
One of the greatest advantages of these applications is that they can complement each other.
Imagine a business that wants to analyse monthly sales and present the results to management.
Step 1: Collect and analyse the data in Excel
Enter sales figures into a spreadsheet. Use formulas to calculate totals, monthly averages, and percentage changes. Create a chart to identify trends.
Step 2: Explain the findings in Word
Prepare a report explaining the sales performance, important observations, possible causes, and recommended actions. Include tables or charts where they support the explanation.
Step 3: Present the key findings in PowerPoint
Create a concise presentation containing the main results, important charts, conclusions, and next steps.
Step 4: Share the files
Save each file in an appropriate format and share it with the intended audience. If your account and applications support cloud collaboration, storing files in OneDrive or SharePoint can help people access the latest versions and collaborate.
Microsoft describes supported file sharing and co-authoring in its official Office collaboration guide.
This workflow avoids trying to perform every task in a single application. Excel handles the calculations, Word provides the detailed explanation, and PowerPoint makes the results easier to present.
7. Practical Example: Preparing a School Science Project
Students can also use the three applications together.
Suppose a student is preparing a project on the growth of plants under different light conditions.
Use Excel to record observations. Create columns for the plant name, light condition, observation date, and plant height. Calculate growth over time and create a chart comparing the results.
Use Word to prepare the project report. Write the aim, hypothesis, materials, procedure, observations, explanation, conclusion, and references. Insert the Excel chart if it helps explain the results.
Use PowerPoint to present the project. Prepare slides covering the research question, experiment setup, selected observations, chart, findings, and conclusion.
This approach develops three valuable skills: clear writing, data analysis, and presentation.
8. Common Mistakes to Avoid
Even experienced users can lose time by choosing the wrong application or using the right one inefficiently.
Using Word as a spreadsheet
Word tables are useful for presenting structured information, but they are not a substitute for Excel when you need extensive calculations, filtering, or data analysis.
Better approach: Maintain the calculations in Excel and insert a relevant summary into Word.
Using Excel for long documents
A spreadsheet is not designed for the same long-form writing and page-layout tasks as a word processor. Long paragraphs and complex document structures can become difficult to manage.
Better approach: Write the report in Word and use Excel for the supporting data.
Putting too much text on PowerPoint slides
Crowded slides make it difficult for the audience to identify the main message.
Better approach: Put detailed explanations in speaker notes or a supporting Word document, and keep the slides focused on key points.
Using too many visual effects
Excessive animations, decorative fonts, and inconsistent colours can distract from the content.
Better approach: Choose a simple visual style and use effects only when they improve understanding.
Forgetting to check the final output
A document may have broken page layouts, a spreadsheet may contain incorrect formulas, and a presentation may have unreadable text on a projector.
Better approach: Review the document, verify the spreadsheet calculations, and rehearse the presentation before sharing or submitting it.
Sharing files without checking permissions
A link to a file may allow more people to view or edit it than intended.
Better approach: Review sharing permissions and grant access only to the people who need it. For supported collaborative workflows, Microsoft recommends using OneDrive or SharePoint and keeping files in compatible formats.
9. Best Practices for Saving and Sharing Office Files
File management is an important part of working with Microsoft Office.
Use the correct file format
- DOCX: Best for editable Word documents.
- XLSX: Best for standard Excel workbooks containing data, formulas, and supported features.
- PPTX: Best for editable PowerPoint presentations.
- PDF: Useful when you want to distribute a document with a relatively fixed layout.
- CSV: Useful for transferring plain tabular data between compatible applications, but it does not preserve workbook formatting, multiple worksheets, or Excel-specific features.
If an Excel workbook contains macros, use a macro-enabled format such as XLSM when appropriate, and only enable macros from sources you trust.
Use meaningful filenames
Instead of saving files with names such as Document1 or FinalFinaluse descriptive names such as:
Science_Project_Report.docxMonthly_Sales_Analysis.xlsxQuarterly_Review_Presentation.pptx
You can also include a date or version number when it helps identify the correct file.
Keep backups of important work
Save important files to a suitable location and maintain backups. Cloud storage can help with synchronisation and recovery, but it should not be treated as a complete substitute for every backup requirement.
Collaborate carefully
When several people work on the same file, use supported sharing and collaboration features rather than repeatedly emailing different copies. This reduces confusion about which version is current.
10. Can You Use Word, Excel, and PowerPoint for Free?
Microsoft offers free web versions of Word, Excel, and PowerPoint through Microsoft 365 for the web. These applications run in a browser and are useful for many everyday tasks, including writing, spreadsheet editing, presentations, and supported online collaboration.
To get started, visit Microsoft 365, sign in with a Microsoft account, and open the application you need.
The web versions do not necessarily include every feature found in the desktop applications. If you depend on advanced formatting, specialised Excel functionality, macros, or other desktop-specific features, check the capabilities of the version and plan available to you.
Paid options include eligible Microsoft 365 subscriptions and one-time Office purchases. The applications and features included depend on the product and license. Microsoft’s official plan comparison provides current plan information.
Frequently Asked Questions
1. Which is better: Word, Excel, or PowerPoint?
None is universally better. Word is best for writing and formatting documents, Excel is best for calculations and data analysis, and PowerPoint is best for presenting information to an audience.
2. Can I insert an Excel chart into Word?
Yes. You can insert or copy a chart from Excel into Word. Depending on how you insert it, the chart may be embedded, linked to the source workbook, or inserted as a static image. Choose the method that suits your need to update or edit the chart later.
3. Can I convert a Word document into a PowerPoint presentation?
Some versions and Microsoft 365 workflows provide features that can help transform document content into a presentation. Availability and results vary. You should review the generated slides and adjust the content and design before presenting.
4. Is Excel difficult for beginners?
Excel is manageable when you learn it step by step. Start with entering data, formatting cells, using SUM and AVERAGE, sorting and filtering records, and creating simple charts. Learn more advanced functions as your needs grow.
5. Do I need to learn all three applications?
If you are a student or office professional, learning the basics of all three is highly useful. You can then develop greater skills in the application most relevant to your studies, job, or business.
6. Can Word, Excel, and PowerPoint work together?
Yes. You can use Excel to analyse data, Word to write a report, and PowerPoint to present the results. The applications also support inserting and sharing content in different ways.
Conclusion
Friends, in this post we have seen the “Microsoft Word, Excel, and PowerPoint differences“. Each application serves a different purpose but complements the others. Word lets you create well-structured documents; Excel lets you turn data into calculations and insights; and PowerPoint lets you present information in an attractive, engaging format.
Smart and productive users do not simply learn the buttons in each application. Rather, they learn something like:
- When to use each tool
- How to organise their work
- How to check the accuracy of their results
- How to share files safely
First, you should try to learn the basics of all these applications. Then gradually practice with some real tasks such as analysing a budget, writing a report, or preparing a presentation. These practical skills will definitely make you very efficient at school, college, work, and in your business.
If you have any queries, you can write to us at support@a5theory.com; we will get back to you ASAP.
Hope! You will enjoy this post, “Microsoft Word, Excel, and PowerPoint differences“.
Please feel free to give your important feedback in the comment section below.
Have a great time!